
Whole genome association meta-analysis on Pavlovian conditioned approach (PavCA) behaviors and related phenotypes in Heterogeneous Stock and Sprague Dawley rat populations
Objectives
The present analysis aimed to 1) perform a GWAS meta-analysis for phenotypes recorded using the Pavlovian conditioned approach (PavCA) test. Twenty-two PavCA indices and related phenotypes were recorded in two different rat populations, Sprague Dawley (SD) and Heterogeneous stock (HS) rats, giving rise to a joint population of 7,215 analyzed individuals and 2) estimate SNP-based heritability and genetic correlation for PavCA indices and related phenotypes for HS.
GWAS meta-analysis results
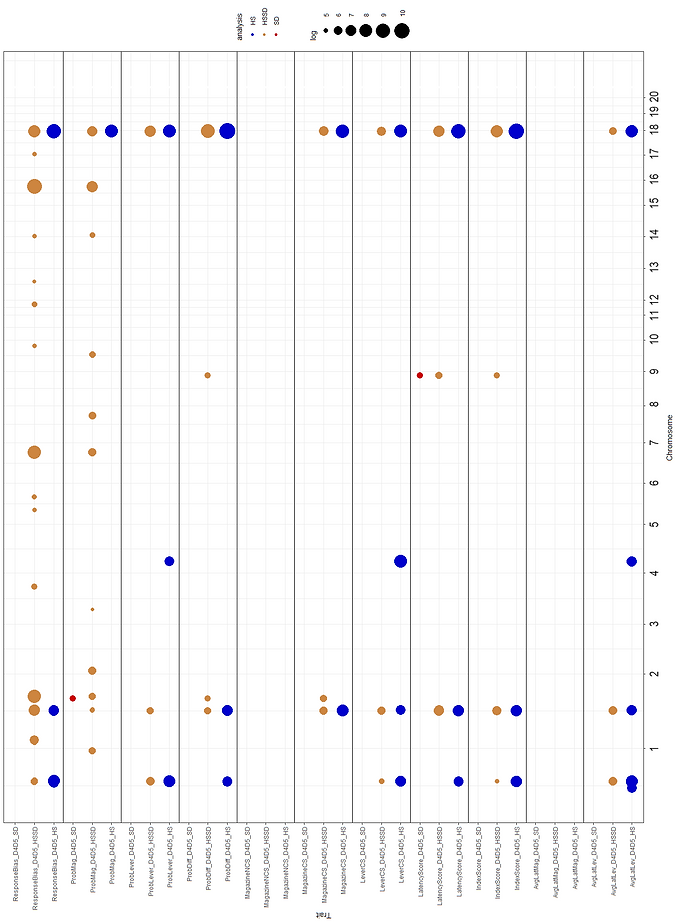
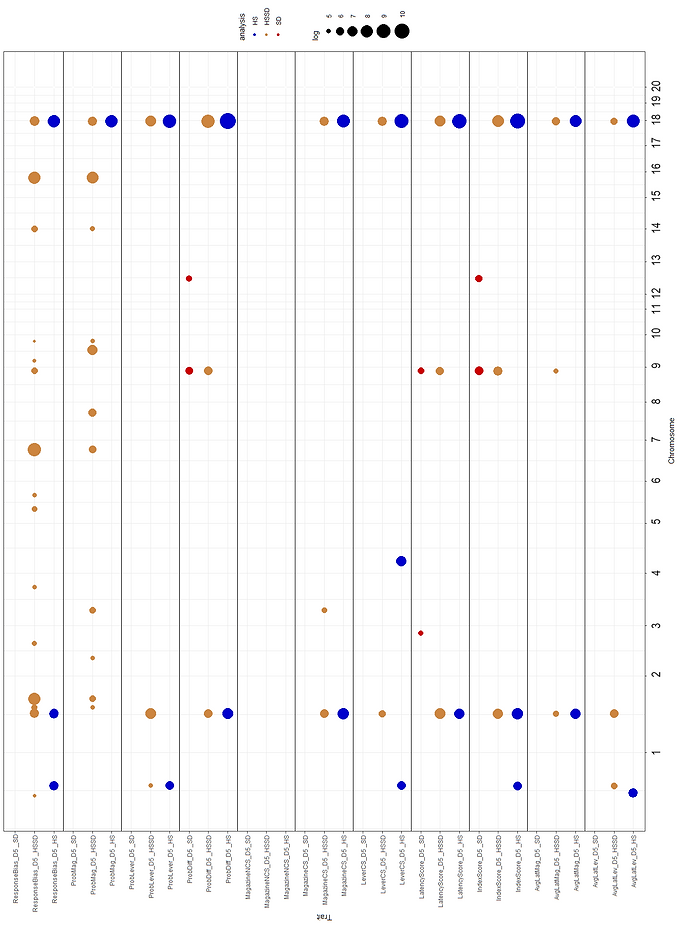
Figures 1 and 2 show the association results for the PavCA meta-analysis for SD, HSSD and HS. A total of 47 regions were identified. Information regarding the most significant phenotype inside each locus is presented. QTLs for several related phenotypes included Chr18_85b (38 associated traits), Chr2_127 (29 associated traits), Chr1_162 (18 associated traits), Chr18_85a (14 associated traits) and Chr9_107 (12 associated traits). Chr18_85b and Chr16_69b harbor the most significantly associated polymorphisms, 18:85,843,693 and 16:69,403,028, associated with ProbDiff_D5 _HS (-Log10=10.75) and ResponseBias_D4D5_HSSD (-Log10=9.3), respectively. QTLs on Chr18_85a and Chr18_85b QTLs are presented in Figure 3 in more detail.
Figure 1. Whole genome association results for the meta-analysis on the Pavlovian conditioned approach (PavCA) test for D4D5 indices. Analysis for eleven traits and related phenotypes recorded in Sprague Dawley (SD, n=3,282) and Heterogeneous Stock (HS, n=3,933). A joint analysis (HSSD) is also shown (total n=7,215). A total of 64,414 (SD), 36,253 (HSSD) and 3,513,321 (HS) markers were used for analysis.
Figure 2. Results for the whole genome association meta-analysis on the Pavlovian conditioned approach (PavCA) test for D5 indices for eleven features and related phenotypes, recorded in session five in Sprague Dawley (SD) and Heterogeneous Stock (HS) rats. Results from the joint analysis for HSSD are also presented. A total number of 7,215 rats were considered distributed as 3,933 SD and 3,282 HS animals; 64,414 (SD), 36,253 (HSSD) and 3,513,321 (HS), markers were used for analysis.
Figure 3. Association meta-analysis results for chromosome 18 in heterogenous stock rats on the Pavlovian conditioned approach (PavCA) test for D4D5 (3A) and D5 (3B) indices for features and related traits. Phenotypes were recorded in 3,282 HS animals.
Figure 4A. Gene distribution and LD estimation for associated markers inside the Chr5_42 QTL are presented. Results for the whole genome association meta-analysis on the Pavlovian conditioned approach (PavCA) test in Sprague Dawley (SD) and Heterogeneous Stock (HS) rats. A total number of 7,215 rats were considered distributed as 3,933 SD and 3,282 HS individuals; 64,414 (SD), 36,253 (HSSD) and 3,513,321 (HS) markers were used for analysis; 4B. Gene distribution and LD estimation for associated markers inside the Chr18:85b QTL are presented. Results for the whole genome association meta-analysis on the Pavlovian conditioned approach (PavCA) test in Sprague Dawley (SD) and Heterogeneous Stock (HS) rats are presented. A total number of 7,215 rats were considered distributed as 3,933 SD and 3,282 HS animals; 64,414 (SD), 36,253 (HSSD) and 3,513,321 (HS) markers were used for analysis.
Figure 5. Gene distribution and LD estimation for associated markers inside the Chr1_159 QTL are presented. Results for the whole genome association meta-analysis on the Pavlovian conditioned approach (PavCA) test in Sprague Dawley, HSSD and Heterogeneous Stock rats are presented. A total number of 7,215 rats were considered distributed as 3,933 SD and 3,282 HS animals; 64,414 (SD), 36,253 (HSSD) and 3,513,321 (HS) markers were used for analysis.
Meta-analysis SNP-based heritabilities and partitioned genetic correlation
Figure 6 shows the SNP-based heritabilities and partitioned genetic correlation estimates for PavCA indices and related phenotypes for the subtraction between sessions four and five, and records from session five in HS. Estimation of SNP-based heritabilities was low to medium, ranging from 9.35±2.97% (AvgLatMag_D4D5) to 23.97±3.98% (LeverCS_D4D5). Based on the partitioned genetic correlation estimates, several phenotypes share a strong genetic correlation (|rg| > 90%). Highly genetically correlated traits include phenotypes for session five and their corresponding record calculated using the difference between sessions four and five, which was expected given that similar data are represented by each measure. In general, the pattern of correlations indicated that the measures of sign-tracking were correlated with each other, but inversely correlated with goal-tracking measures which similarly were correlated with each other. The intertrial interval measures were only weakly correlated with some of these measures.
Figure 6. SNP based heritability (diagonal) and partitioned genetic correlation (off-diagonals) heat map for twenty-two PavCA indices and related phenotypes. Phenotypes represent an estimation of the difference between sessions four and five, and records from session five in Heterogeneous Stock rats. A total number of 3,282 HS rats and 3,513,321 polymorphisms were assessed; n.s.=no significant estimate.
Conclusion
The selected candidate genes mapped for the CCC behavioral test included CYP4F6, TRPV2 (Actg), PENK and ZSWIM6 (Distg). These genes encode a monooxygenase enzyme involved in metabolism, a cannabinoid receptor, an opioid peptide, and a Zinc Finger, respectively. The association analysis for the CCP behavioral test identified SLC6A15 (Actg), LARGE1 (Timeg) and GPR161 (Distg) as candidate genes. These genes are involved in neurodegenerative disorders and synaptic plasticity. Together, these genes in the present analysis were able to explain variability associated with behavior in a HS rat population, expressed as locomotion and activity shared between males and females after cocaine exposure.
The present analysis makes evident the great potential of GWAS-SEM analysis for understanding complex relationships between behavioral phenotypes such as comportment modification related to psychostimulant exposure, which usually includes low powered traits. By applying multivariate GWAS-SEM based analysis on univariate summary statistics we were able to model latent constructs devoid of measurement error and more suitable for gene discovery. Genes located inside the associated loci are likely overlooked when using the standard univariate GWAS analysis. The mapped loci harbor a number of genes that are biologically relevant based on function, and associated pathways identified in previous research such as PENK and TRPV2. Another remarkable aspect of this type of analysis is that multiple phenotypes are required to have a better understanding of an abstract latent variable, noticeable in this case when multiple recordings across time are present, since the phenotype can change and evolve over time, being an expression of neuroadaptation. These analyses show that within-task measures of cocaine sensitivity and conditioned effects are phenotypically correlated, but the genetic bases of these measures between CCC and CCP are mostly independent. This underscores the complex genomic landscape of cocaine sensitivity in rodent models, while highlighting the utility of GWAS-SEM in identifying potential targets for the treatment of substance use disorder.