Structural equation modeling uncovers genetic loci underlying cocaine’s conditioned effects in Heterogeneous Stock rats
Objectives
The objective of this research was to use GWAS-SEM to analyze two cocaine conditioning phenotypes. Cocaine contextual conditioning (CCC) measures conditioned locomotion by testing the ability of a cocaine-paired context to elicit a conditioned locomotor response. Another advantage of CCC is that it captures the sensitivity to cocaine-induced locomotion (Hughson et al., 2019). Cocaine cue preference (CCP) is similar but replaces a context with a more specific (tactile) cue (Cunningham et al., 2006; Meyer et al., 2012; King et al., 2021) and also measures the preference for this cue versus a saline-paired tactile cue. We used CFA to model latent factors for both behavioral paradigms jointly.
Phenotyping
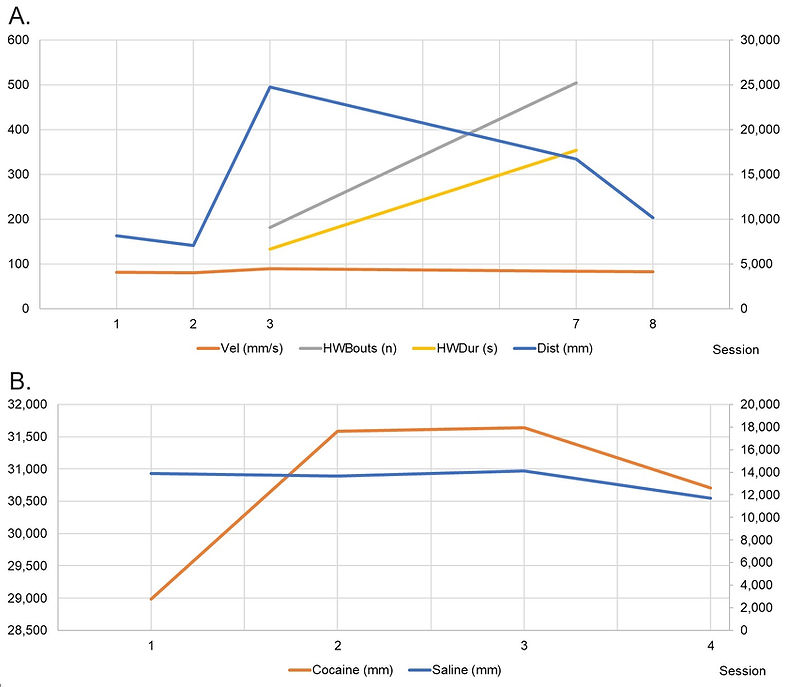
The CCC session with the lowest average traveled distance and lowest average velocity was identified in session two (Figure 1A). The session showed the highest average traveled distance and average velocity, which was found in session three. Session seven showed the highest average number of head waving bouts and bout duration compared to session three. The average distance traveled, measured in the CCP approach (Figure 1B), was higher when the animals received the cocaine injection than when the saline solution was provided. For sessions one, two, three, and four, this value increased 2.08, 2.31, 2.23, and 2.62 times when comparing saline and cocaine exposure.
Figure 1. Rat performance for phenotypic traits by session. 1A. For CCC. Primary y-axis illustrates phenotypic distribution for Vel, HWBouts and HWDur. Secondary y-axis represents phenotypic distribution for Dist; 1B. For CCP. Primary y-axis shows distribution for cocaine exposure; secondary y-axis illustrates trait scale for saline treatment.
Phenotypic correlation estimation
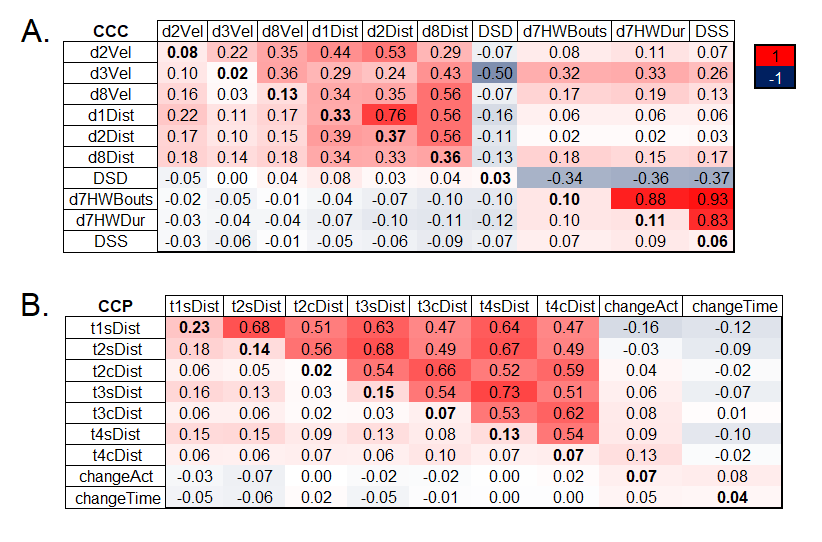
Figure 2 shows the phenotypic correlation for the observed phenotypes of the CCC and CCP behavioral tests included in the final CFA models. For CCC, two clusters are identified. The first cluster included d2Vel, d3Vel, d8Vel, d1Dist, d2Dist and d8Dist. A second cluster included d7HWBouts, d7HWDur, DSD, and DSS. One CCP cluster was identified, including six measurements related to distance (t2sDist, t2cDist, t3sDist, t4sDist, and t4cDist).
Figure 2A. Phenotypic correlations using the adjusted observed phenotypes for the CCC behavioral tests (above the diagonal). SNP-based heritabilities (diagonal) and partitioned genetic correlations (below the diagonal) for CCC are also presented. 2B. Phenotypic (above diagonal) and partitioned genetic (below diagonal) correlations, and heritabilities (diagonal) for CCP. A heterogeneous stock rat population, including 1,376 individuals for CCC and 1,674 individuals for CCP was analyzed. Phenotypic correlations were determined by the R function “cor” (R Core Team, 2018). SNP-based estimation of heritability and partitioned genetic correlations were calculated using LDSC v1.0.1 (Bulik-Sullivan et al., 2015). Animals were genotyped for 3,5 million markers using genotyping-by-sequencing and tested for CCC and CCP behavior. Abbreviations for CCC: d2Vel (velocity day two), d3Vel (velocity day three), d8Vel (velocity day eight), d1Dist (distance day one), d2Dist (distance day two), d8Vel (velocity day eight), DSD (degree_sens_dist), head waving-bouts seventh day (d7HWBouts), and head waving-duration seventh day (d7HWDur), and DSS (degree_sens_stereotypy). Abbreviations for CCP: t1sDist (trial one saline distance), t2sDist (trial two saline distance), t2cDist (trial two cocaine distance), t3sDist (trial three saline distance), t3cDist (trial three cocaine distance), t4sDist (trial four saline distance), t4cDist (trial four cocaine distance), changeAct (change in locomotion comparing the pre- and post-test), and changeTime (difference in time between pre- and post-conditioning).
Univariate genetic association analysis
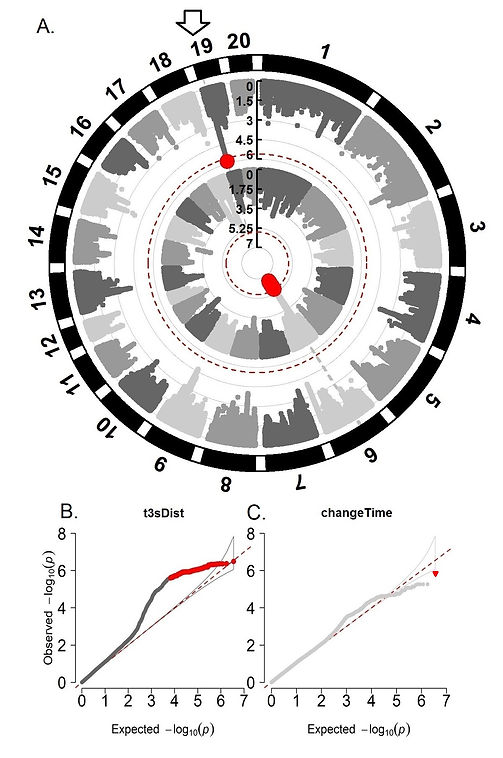
Figures 3A-C show the results of the univariate genetic association analysis for traits related to distance and time from the CCP behavioral test, t3sDist, and changeTime. These two phenotypes were the only ones showing significance for the univariate analysis out of both CCC and CCP behavioral tests.
Figure 3A. Univariate whole-genome association results for t3sDist (internal circle) and changeTime (external circle) from the CCP behavioral test. 3B. and 3C. show deviation of the observed probabilities from the expected for t3sDist (distance day three) and changeTime (difference in time between pre and post-conditioning), respectively. A total of 1,376 (CCC) and 1,674 (CCP) heterogeneous stock rats were analyzed. These animals were genotyped for 3,5 million polymorphisms using genotyping-by-sequencing and tested for CCP. The significance threshold used was (-log10) 5.6. The white arrow represents a shared region identified across the univariate and multivariate analysis. Significant markers are presented in red. A Q-Q plot is a graphical illustration showing the deviation of the observed probabilities from the null hypothesis. The white arrow represents an overlapping associated marker between changeTime and Timeg from CCP (chr19:12,763,768).
Confirmatory factor analysis
The final Actg-Distg-Velg CFA model for the CCC behavioral test shows that these latent variables are measured by d7HWDurg, d7HWBoutsg, and DSSg; D1distg, D2distg, D8distg, and DSDg; and d2Velg, d3Velg, and d8Vel, respectively. Figure 4A shows the CFA model and GenomicSEM solutions for the genetically defined construct, Actg-Distg-Velg. The estimated chi2 was not significant for the theoretical SEM model (chisq = 39.32; df = 32; p_chisq = 0.17; number of fitted traits = 10). Partitioned genetic correlation between the latent variables of the CCC behavioral test were the following: -0.46±0.25 for Actg-Distg, -0.3±0.39 for Actg-Velg, and 0.9±0.13 for Distg-Velg. d7HWDurg and DSSg contributed the highest amount of additive genetic variance to the latent phenotype Actg. Variables d1Distg, d2Distg, and d8Distg contributed the highest amount of additive genetic variance to the latent variable Distg. D2Velg contributed the highest amount of additive genetic variance to the latent variable Velg. The first alternative SEM model used for comparison performed more poorly than the theoretical SEM model. The performance of this model was the following: chisq = 53.07; df = 34; p_chisq = 0.01; number of fitted traits = 10. The second alternative model did not fit the sample data. It showed a negative estimation of variances. The initial theoretical SEM model was selected and used for additional analysis.
Figure 4A. Diagram of the CFA and Genomic SEM solutions for the genetically defined construct, Actg-Distg-Velg (blue ellipses); The additive genetic correlation for Actg-Distg-Velg is shown as red arrows. 4B. CCP-CFA diagram and Genomic SEM solutions for the genetically defined construct, Activity-Distance-Time (blue ellipses). The additive genetic correlation for Activity-Distance-Time is shown as red arrows. Standardized results and standard errors estimated applying DWLS are shown. Results were standardized using the amount of additive genetic variance shared between d7HWDurg and Actg. Estimated standard errors are presented in parentheses. Significance of the estimation is also presented (+ <0.05; * <0.01; ** <0.0001). The g suffix in the diagram denotes additive genetic indicators; u prefix denotes additive residual variance in the indicators not explained by the latent variables of the CCC and CCP behavioral test, respectively. A total of 1,376 (CCC) and 1,674 (CCP) heterogeneous stock rats were analyzed. Abbreviations for CCC: head waving-duration seventh day (d7Dur), head waving-bouts seventh day (d7Bouts), degree_sens_stereotypy (DSS), distance day one (d1Dist), distance day two (d2Dist), distance day eight (d8Dist), degree_sens_dist (DSD), velocity day two (d2Vel), velocity day three (d3Vel), and velocity day eight (d8Vel). Abbreviations for CCP: Change in locomotion comparing the pre- and post-test (changeAct), trial one saline distance (t1sDist), trial two saline distance (t2sDist), trial two cocaine distance (t2cDist), trial three saline distance (t3sDist), trial three cocaine distance (t3cDist), trial four saline distance (t4sDist), trial four cocaine distance (t4cDist), and difference in time between pre- and post-conditioning (changeTime).
The SNP-based estimation of heritability for CCC calculated was low for d2Velg, d3Velg, d8Velg, DSDg, d7HWBoutsg, d7HWDurg, and DSSg. Medium heritability was identified for d1Distg, d2Distg, and d8Distg. No trait showed high (>0.5) SNP-based heritability (Figure 2). Medium positive partitioned genetic correlations were present for d1Distg-d2Velg, d2Distg-d1Distg, d1Distg-d8Distg, and d2Distg-d8Distg. No medium negative partitioned genetic correlations for CCC were found.
The CFA model for CCP was identified including Activity-Distance-Time. Genomic SEM solutions for this genetically defined construct are shown in Figure 4B. Variables changeActg and changeTimeg measured the latent variables Actg and Timeg, respectively. The estimated chi2 was not significant for this SEM model (chisq = 28.66; df =26; p_chisq = 0.32; AIC = 66.66; CFI = 0.99; SRMR = 0.18; traits = 9). The variables t1sDistg, t2sDistg, t2cDistg, t3sDistg, t3cDistg, t4sDistg and t4cDistg measured Distg. Partitioned genetic correlations for the latent variables of the CCP behavioral test, Activity-Distance-Time were calculated as: -0.25±0.31 for Activity-Distance, 0.77±0.63 for Activity-Time and -0.41±0.38 for Distance-Time, respectively; t2sDist and t4sDist contributed the highest amount of additive genetic variance to the latent variable Distance.
The SNP-based heritability for CCP was computed as medium for t1sDist (23.13±5.59%). For the remaining traits used for the CFA test, SNP-based heritability was low, going from 14.6±6.18% (t3sDist) to 1.58±4.16% (t2cDist). No trait showed a high (>0.5%) SNP-based heritability estimate (Figure 2B). All estimated partitioned correlations were low (between -0.2 and 0.2).
The final alternative model fitting all traits associated with CCC and CCP was discarded. All variables included in the CCC behavioral test related to Distg were excluded from the final CFA model and replaced by CCP variables, which was not desirable for the present analysis. This result could be explained by the high correlation between all variables related to Distg from CCP (Figure 3B), allowing them to fit better in the final CFA when compared with traits included in CCC. Therefore, separate CFA models for CCC and CCP were fitted and used for additional analysis.
Multivariate genetic association analysis
Genetic association analysis results for the CCC panel
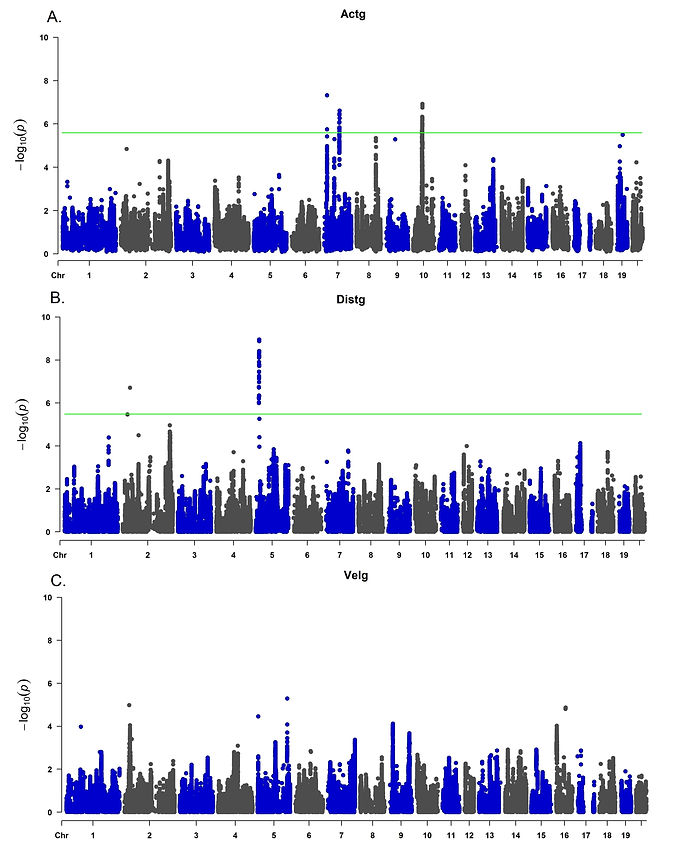
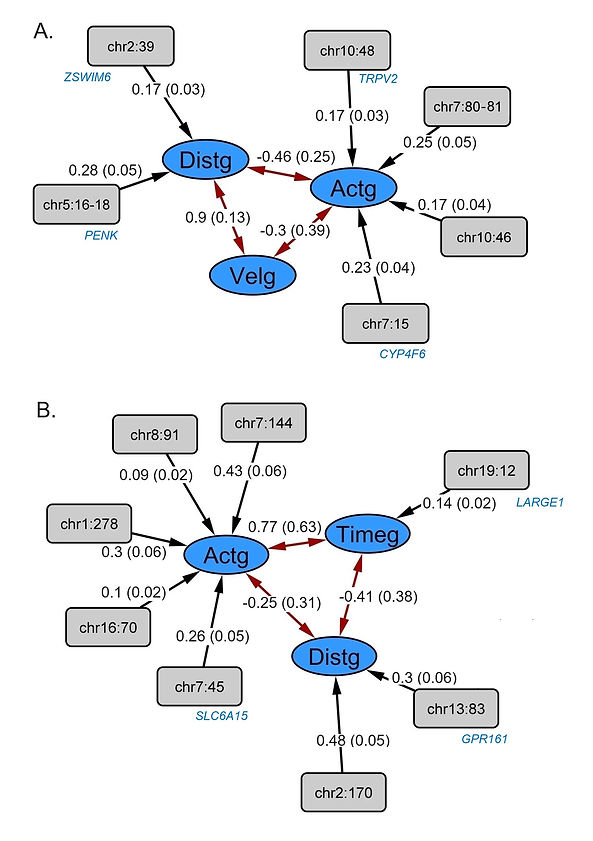
The results from the multivariate genetic association analysis are shown in Figure 5. The significant loci identified for Actg included polymorphisms inside Chr7:15 Mb, Chr7:80-81 Mb, Chr10:46 Mb, and Chr10:48 Mb. For Distg, Chr2:39 Mb and Chr5:16-18 Mb were identified. No associated locus was identified for Velg. The associated loci were annotated for reported QTLs using the rat genome database (Smith et al., 2020; Vedi et al., 2023) and Biomart (Gutiérrez-Gil et al., 2015; Zerbino et al., 2018) to identify reported associated loci. Genes previously associated with motor and behavioral phenotypes were selected for further discussion. The main identified candidate genes related to traits potentially associated with motor activity and behavior include Cytochrome P450, family 4, subfamily f, polypeptide 6 (CYP4F6), Proenkephalin (PENK), Transient receptor potential cation channel subfamily V member 2 (TRPV2) and Zinc finger SWIM-type containing 6 (ZSWIM6) (Figure 7A). For CCP, LARGE xylosyl- and glucuronyltransferase 1 (LARGE1), G protein-coupled receptor 161 (GPR161) and Solute carrier family 6 member 15 (SLC6A15) were selected (Figure 7B) for further discussion. Regional association plots for PENK (Figures 8A), CYP4F6 (Figures 8B) and TRPV2 (Figure 9).
Figure 5. Multivariate genetic associations analysis results for the CCC behavioral test. Association analysis for the latent phenotypes Actg (5A), Distg (5B), and Velg (5C). The adjusted genome-wide association threshold estimated was 5.6 (-log10). This threshold was calculated using permutation. A total of 1,376 heterogeneous stock rats were analyzed. These animals were genotyped for 3,5 million markers using genotyping-by-sequencing and tested for CCC behavior.
Figure 6. Genomic SEM solutions for the genetically defined constructs, Actg-Distg-Velg (6A); and Actg-Distg-Timeg (6B) from CCC and CCP behavioral tests, respectively. Associated loci are displayed. Standardized results and standard errors estimated applying DWLS are shown. Estimated standard errors are presented in parentheses. The g suffix in the diagram denotes additive genetic indicators. The additive genetic correlation for all latent variables is shown as red arrows. Associated loci are presented as rectangular nodes since they are considered as an observed piece of information through genotyping. If a candidate gene was selected for the associated locus, it is shown below each node. If a locus spanning multiple associated markers is presented, the highest standardized result value amongst all the polymorphisms inside the locus is displayed. A total of 1,376 and 1,674 heterogeneous stock rats were analyzed for CCC and CCP, respectively. These animals were genotyped for 3,5 million markers using genotyping-by-sequencing and tested for CCC and CCP behavioral test.
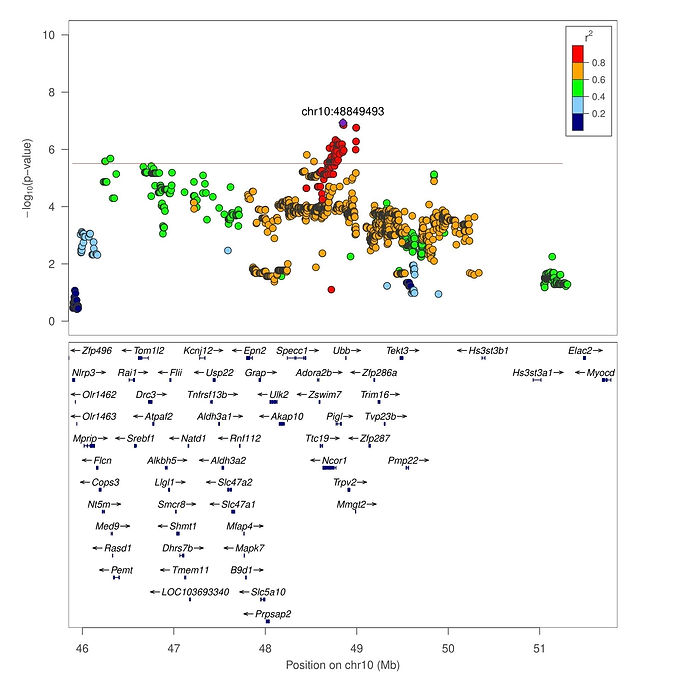
Figure 7A. Regional Manhattan plot for chr5:16-18 Mb. Detail of the significantly associated region on chromosome 5 which harbors PENK; 7B. Regional Manhattan plot for chr7:15 Mb, harboring the CYP4F6 gene; 8C. Regional Manhattan plot for chr10:48 Mb and TRPV2. The association analysis was performed using the R package GenomicSEM. The green line represents the corrected p-value threshold obtained using permutation. The estimated threshold was equal to 5.6 (-log10). LD estimation between markers is presented.
Figure 8. Regional Manhattan plot for chr10:48 Mb and TRPV2. The association analysis was performed using the R package GenomicSEM. The green line represents the corrected p-value threshold obtained using permutation. The estimated threshold was equal to 5.6 (-log10). LD estimation between markers is presented.
Genetic association analysis results for the CCP behavioral test
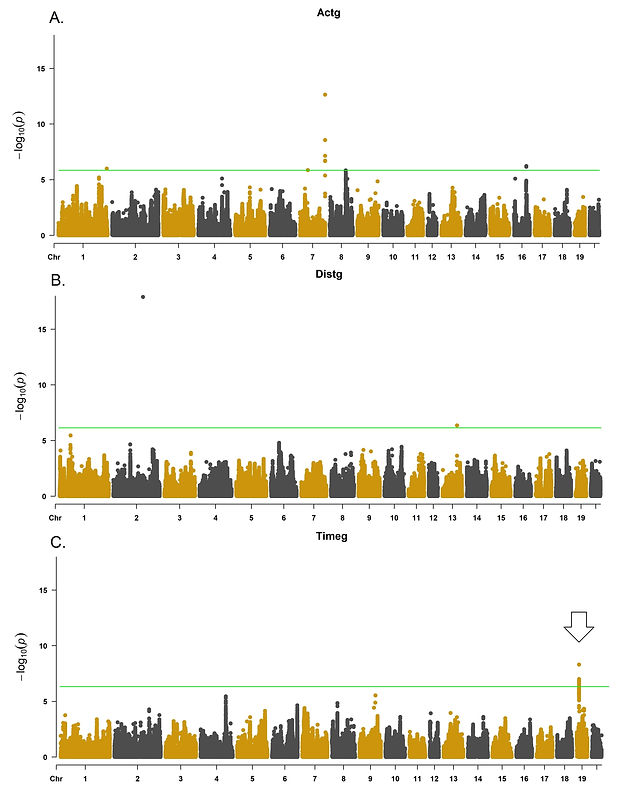
Figure 9 presents the multivariate genetic association analysis results for CCP (Actg, Distg, and Timeg, and the association results for Activity (Actg), Distance (Distg), and Time (Timeg), respectively. A total number of eight regions were identified as associated with CCP using the GWAS-SEM approach, including: chr1:278 Mb, chr7:45 Mb, chr7:144 Mb, chr8:91 Mb and chr16:70 Mb (Actg); chr2:170 Mb, chr13:83 Mb (Distg) and chr19:12 Mb (Timeg). For Actg, 97 polymorphisms were significantly associated; Six and 101 markers were associated with Distg and Timeg, respectively. The Zoom locus plot for the associated loci is shown in Figure 10.
Figure 9. Results for the CCP multivariate genetic association analysis behavioral test. The analysis was performed using the constructed latent variables Actg (9A), Distg (9B), and Timeg (9C). The p-value Q-Q plots are shown in the Supplementary Figure 2. The whole-genome association threshold was equal to 5.6 (-log10). A heterogeneous stock rat population, including 1,674 animals, was analyzed. These animals were assessed for CCP related phenotypes. The white arrow represents an overlapping associated locus between changeTime and Timeg from CCP (chr19:12,763,768).
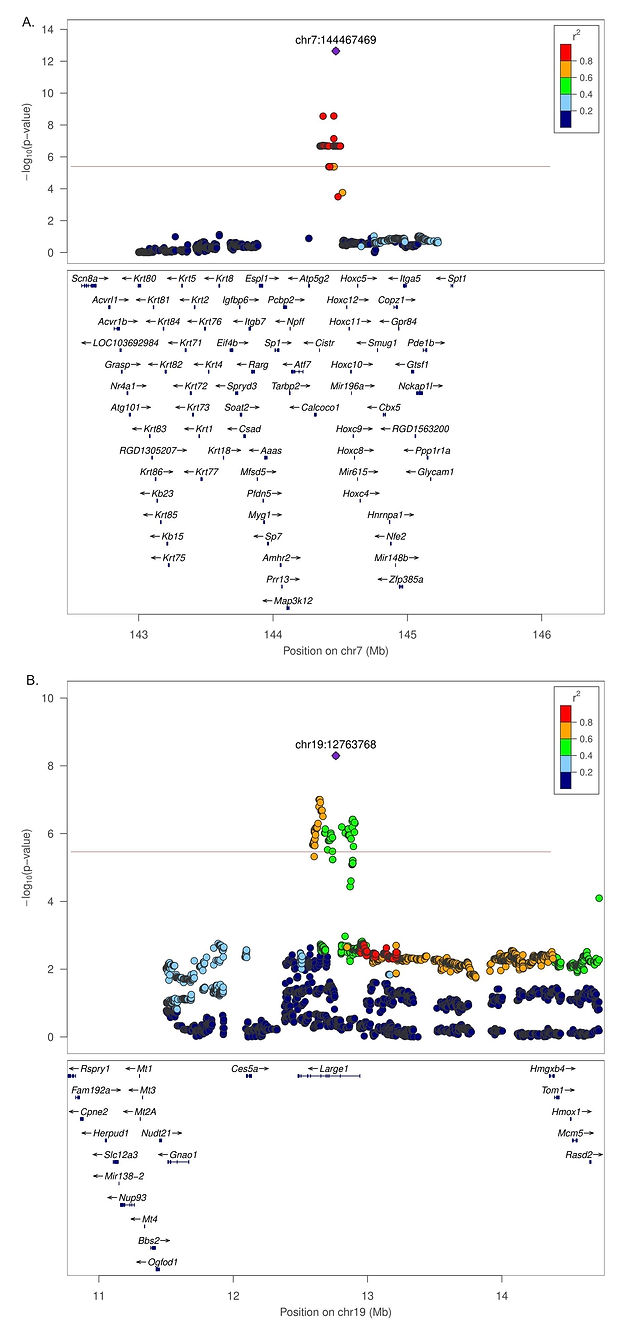
Figure 10. Regional Manhattan plot for chr7:144 Mb (10A.) and chr19:12 Mb (10B.). The multivariate association analysis was performed using the R package GenomicSEM. The green line represents the corrected p-value threshold, estimated to be equal to 5.6 (-log10). LD estimation between markers is presented.
Conclusion
The selected candidate genes mapped for the CCC behavioral test included CYP4F6, TRPV2 (Actg), PENK and ZSWIM6 (Distg). These genes encode a monooxygenase enzyme involved in metabolism, a cannabinoid receptor, an opioid peptide, and a Zinc Finger, respectively. The association analysis for the CCP behavioral test identified SLC6A15 (Actg), LARGE1 (Timeg) and GPR161 (Distg) as candidate genes. These genes are involved in neurodegenerative disorders and synaptic plasticity. Together, these genes in the present analysis were able to explain variability associated with behavior in a HS rat population, expressed as locomotion and activity shared between males and females after cocaine exposure.
The present analysis makes evident the great potential of GWAS-SEM analysis for understanding complex relationships between behavioral phenotypes such as comportment modification related to psychostimulant exposure, which usually includes low powered traits. By applying multivariate GWAS-SEM based analysis on univariate summary statistics we were able to model latent constructs devoid of measurement error and more suitable for gene discovery. Genes located inside the associated loci are likely overlooked when using the standard univariate GWAS analysis. The mapped loci harbor a number of genes that are biologically relevant based on function, and associated pathways identified in previous research such as PENK and TRPV2. Another remarkable aspect of this type of analysis is that multiple phenotypes are required to have a better understanding of an abstract latent variable, noticeable in this case when multiple recordings across time are present, since the phenotype can change and evolve over time, being an expression of neuroadaptation. These analyses show that within-task measures of cocaine sensitivity and conditioned effects are phenotypically correlated, but the genetic bases of these measures between CCC and CCP are mostly independent. This underscores the complex genomic landscape of cocaine sensitivity in rodent models, while highlighting the utility of GWAS-SEM in identifying potential targets for the treatment of substance use disorder.